These sections describe a few common problems we face on our infrastructure and tips on how to solve them.
Roll back (revert) a helm deploy
Sometimes it is useful to simply revert a Kubernetes deployment with Helm.
For example, if you’ve manually deployed something via helm upgrade, and notice that something is wrong with our deployment.
If you’d simply like to revert back to the state of the Kubernetes infrastructure from before you ran helm install, try the following commands:
Get the deployment name and revision number for the latest deploy. To do so, run this command:
helm list --namespace {{NAMESPACE}}Roll back the deployment to the previous revision, using the information output from the above command:
helm rollback --namespace {{NAMESPACE}} {{DEPLOYMENT_NAME}} {{REV_NUM - 1}}The {{REV_NUM - 1}} simply means “deploy the previous revision number”. Usually,
NAMESPACEandDEPLOYMENT_NAMEare identical, but always best to double check.
This should revert the Helm deployment to the previous revision (the one just before you ran helm upgrade).
Prometheus server is out of memory (OOM)
Prometheus collects Kubernetes metrics for our grafana charts and often requires a lot of memory during startup.
If the server runs out of memory during the startup process, this presents itself as a “Timed out waiting for condition” error from helm on the command line, and OOMKilled events in the prometheus server pod events before the pod reverts to CrashLoopBackOff status.
This might also block our CI/CD system from updating the hubs on the cluster if the support chart requires an upgrade after a Pull Request is merged.
To resolve this issue, we feed prometheus more RAM which you can do by adding the below config to the support.values.yaml file under the relevant folder in config/clusters.
prometheus:
  server:
    resources:
      limits:
        memory: {{RAM_LIMIT}}
The default for this value is 4GB.
Try increasing this value in small increments and deploying using deployer deploy-support {{CLUSTER_NAME}} until the server successfully starts up.
Then make a Pull Request with your updated config.
Failure calling validation webhook for support components
After addressing Prometheus server is out of memory (OOM), you may see the following error when redeploying the support chart:
Error: UPGRADE FAILED: cannot patch "support-prometheus-server" with kind Ingress: Internal error occurred: failed calling webhook "validate.nginx.ingress.kubernetes.io": Post "https://support-ingress-nginx-controller-admission.support.svc:443/networking/v1beta1/ingresses?timeout=10s": x509: certificate signed by unknown authorityYou can resolve this by deleting the webhook and redeploying - helm will simply recreate the webhook.
kubectl -A delete ValidatingWebhookConfiguration support-ingress-nginx-admissionwhere the -A flag will apply this command across all namespaces.
No space left on device error
If users report a No space left on device error message when trying to login or
use an nbgitpuller link, this is because the NFS mount storing users home
directories is full. We rectify this by increasing the size of the NFS store.
GCP Filestore
Navigate to https://
console .cloud .google .com /filestore /instances and ensure the correct Google Cloud project is selected in the top menu bar Select the Filestore you wish to resize from the list
Click the “Edit” button at the top of the page
Add the new capacity in the “Edit capacity” field. The value is Terabytes (TiB).
Click “Save”. Once this update has precipitated, users should now be able to login again.
Follow-up this workflow with a PR to the infrastructure repo that updates the size of the Filestore in the appropriate
.tfvarsfile (underterraform/gcp/projects) to match the change made in the console
Manual NFS deployment to a VM on GCP
Navigate to https://
console .cloud .google .com /compute /disks and ensure the correct Google Cloud project is selected in the top menu bar Select the disk named
hub-homes-01. The “Details” page should show “In use by:nfs-server-01”.Click the “Edit” button at the top of the page
Add the new disk size in the “Size” field under “Properties”. The value is Gigabytes (GB).
Click “Save”
Navigate to the NFS VM that has the disk you just edited mounted to it. You can quickly get there by clicking
nfs-server-01in the “In use by” field on the “Details” page of the disk.SSH into this VM. There is a dropdown menu called “SSH” at the top of the page that provides a variety of options to gain SSH access.
Once you have successfully SSH’d into the machine, run the following command to expand the filesystem:
sudo xfs_growfs /export/home-01/
Resetting a GitHub OAuth app when users are faced with a 403 Forbidden error at login
When we setup authentication to use GitHub orgs or teams, we create an OAuth app in the 2i2c org, regardless of which org we are authenticating with.
Upon the first login, the admins of the target org need to grant permissions to this app to read their org info.
If they don’t do this correctly, all users will report a 403 Forbidden error when they try to login.
Find and select the appropriate OAuth app in the 2i2c GitHub org
Under “General” settings for the app, click the “Revoke all user tokens” button. For all users that have previously attempt to login, this will force them to login again. Including you!
Log into the affected hub again. You will repeat the OAuth flow and be asked to authorise the OAuth app again. You will be presented with a list of all the GitHub orgs related to your account. Some will already be authorised and have a green tick next to them, others where you are a member will have a “Request” button next to them. Orgs where you are an admin will have a “Grant” button next to them. Click the “Grant” button next to the target org before clicking the green “Authorize” button. For example, see the below screenshot where we wish to grant the
nasa-cryo-stagingOAuth app access to thebinderhub-test-orgorg.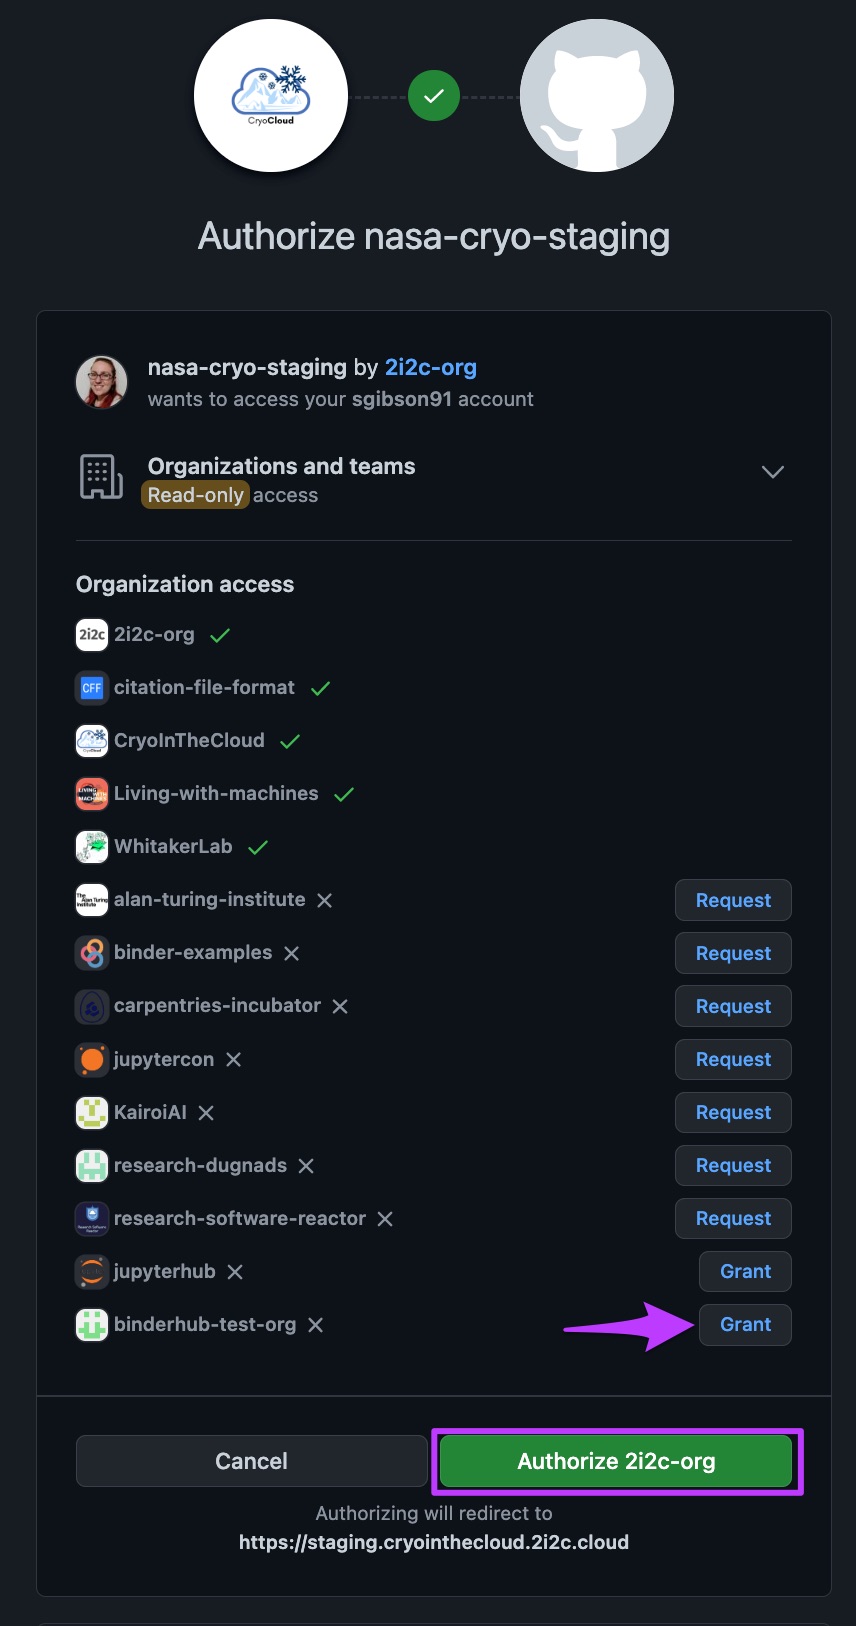
How to grant org access to an OAuth app on GitHub
The OAuth app will now have the correct permissions to read the org info and hence users should be able to successfully log into their hub.
Accessing the job matrices generated in CI/CD
Sometimes we need to inspect the job matrices the deployer generates for correctness.
We can do this either by inspecting the deployment plan that is posted to PRs
or by running the generate helm-upgrade-jobs command of the deployer locally.
This will output the same deployment plan that is used in the PR comment, which is
a table formatted by rich. However, we sometimes
need to check the JSON itself for correctness, for example, in cases when our
CI workflow fails with JSON issues. To achieve that, we need to set some environment
variables.
export CI=trueThis will trigger the deployer to behave as if it is running in a CI environment.
Principally, this means that executing generate helm-upgrade-jobs will write
two files to your local environment. The first file is called pr-number.txt
and can be ignored (it is used by the workflow that posts the deployment plan
as a comment and therefore requires the PR number). The second file we set the
name of with our second environment variable.
export GITHUB_OUTPUT=test.txt # You can call this file anything you like, it's the setting of GITHUB_OUTPUT that's importantThis mimics the GitHub Actions environment where a GITHUB_OUTPUT file is available
to store and share output variables across steps/jobs, and this will be where
our JSON formatted job matrices will be written to.
Now we’re setup, we can run:
deployer generate helm-update-jobs {comma separated list of changed files}where the list of changed files you can either provide yourself or you can copy-paste
from the GitHub Actions logs by visiting an executed run of the “Deploy and test hubs”
workflow at a URL such as https://generate-jobs job, and then expanding the “Generate matrix jobs” step logs.
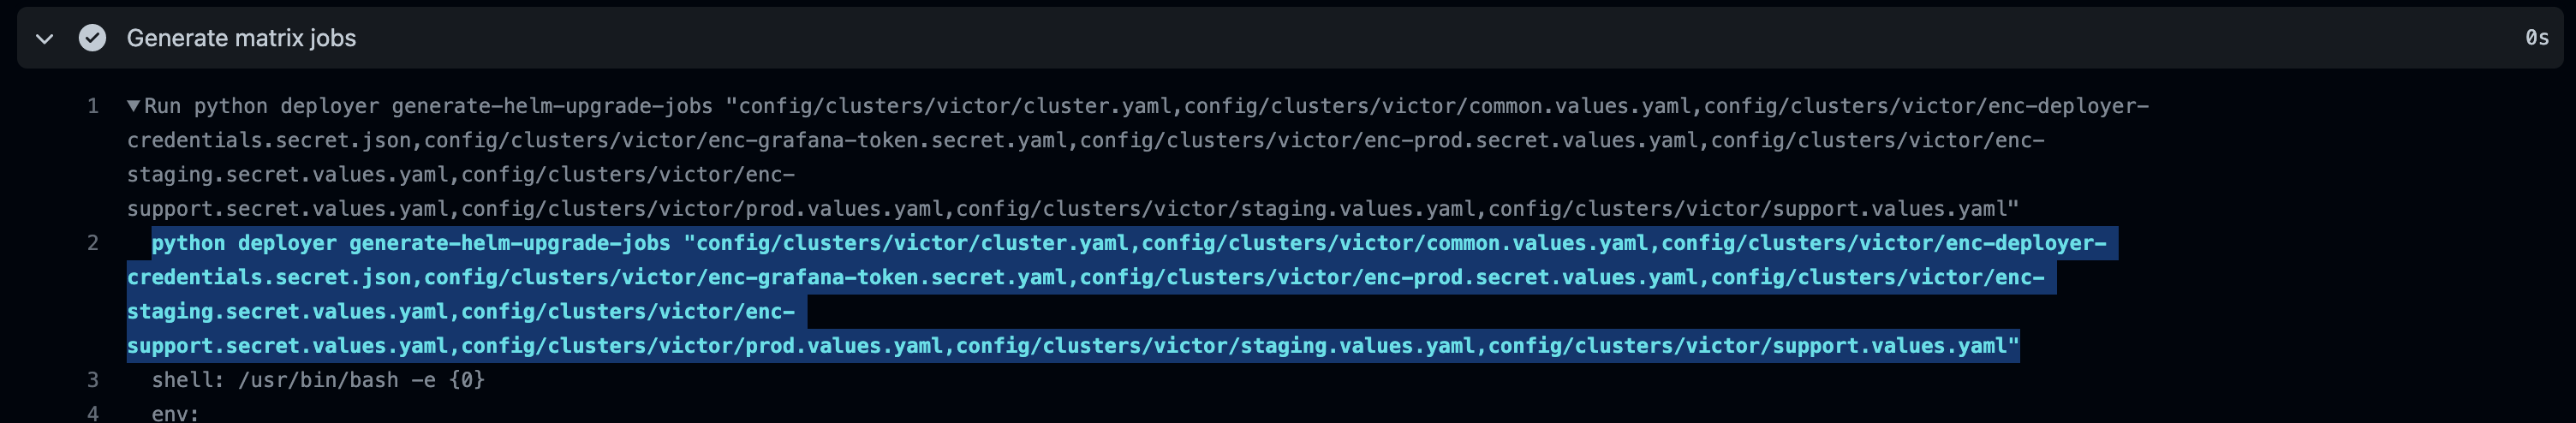
Where to find a list of changed files from GitHub Actions logs
Once you have executed the command, the JSON formatted job matrices will be available
in the file set by GITHUB_OUTPUT in the following form:
prod-hub-matrix-jobs=<JSON formatted array>
support-and-staging-matrix-jobs=<JSON formatted array>